Content Management System for Music eCommerce site
Beatbox is a website that licenses out music to clients working in TV, movies, advertising, etc. The core component of the website is a music player on the frontend where users can search through, play, and download tracks. As well as this, there is also functionality to add tracks to a ‘project’ which can then be shared with other users. There is also a CMS (Content Management System) section of the site where an administrator can login to control aspects of how the site appears without needing to type any code. This includes the ability to upload tracks as well as modify the data to change the content appearing on the frontend. The client has asked for us to add a section to the admin side of the site that allows for them to view data on the activity of users on the frontend. For every action on the frontend, the data is logged and this logged data should be compiled and displayed as a report on the admin of the website. This reports section is what I’ll be focusing on here in this blog post.
The Design
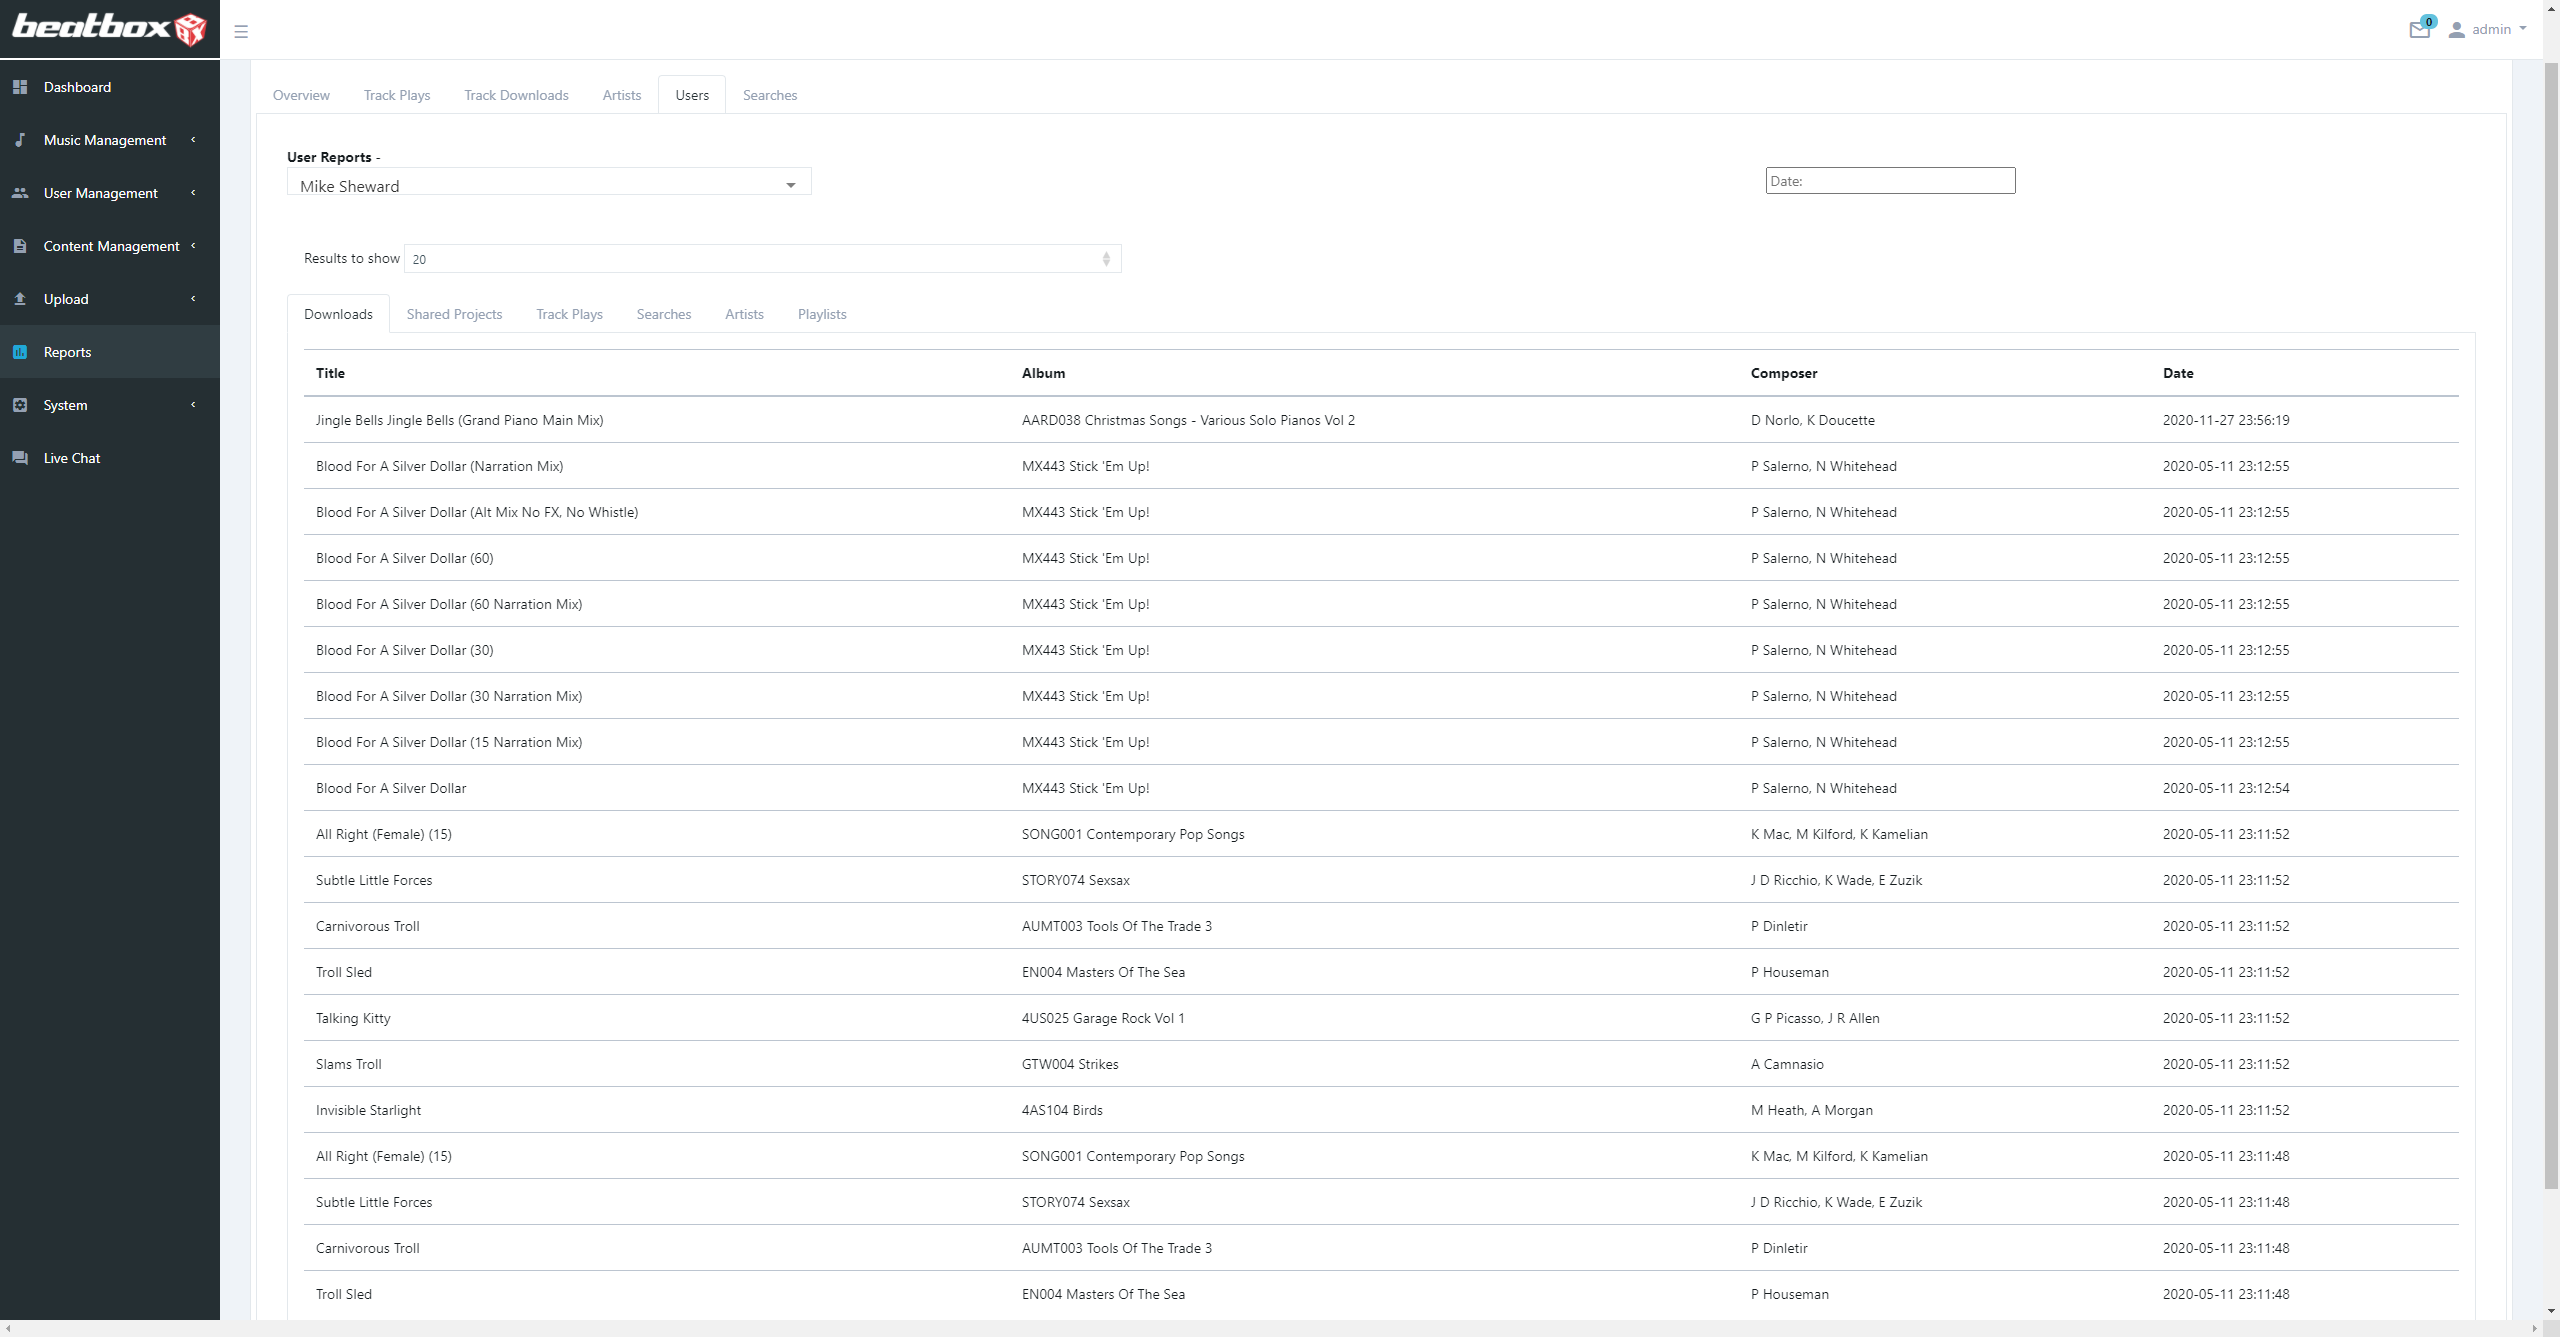
The main layout of this page is a tabbed interface, with tabs at the top of the screen which switch between data about certain aspects of the frontend of the site, to review what’s being played/downloaded by who and at what times, etc. I applied concepts of Human Computer Interaction here, by laying out the content clearly and consistently. This has been done by leaving spacing between the content making it easier to digest. To make it clear which tab is selected the use of colours was introduced by giving an outline and making the inactive tabs greyed out. The colourways used were implemented with the end user in mind, grey was used as this is widely recognised by users as an item being inactive or disabled this also distinguishes itself from the active tab. The table has been laid out to clearly separate all rows and columns, as well as making it clear which row is the header by making the header text bold to make it stand out.
Consistency was key in this design. Human Computer Interaction guidelines attach a significant importance to the consistency of the various sections of a site. This analytics module follows these guidelines by using the same basic layout on all of the tabs when displaying data. This includes always displaying the currently active tab the same way, keeping the text the same colour, as well as making sure the items outside the table (filter options, pagination, export button) are all in the same place and designed the same way on all pages. This is so the knowledge of how all of these functions work can be carried over regardless of which tab the user is on.
With the order of items on the page, we took into account the path a user takes when viewing this page. The user would start at the top with the tabs, then below it would go to the search bar & user filter, and then once the filters have been selected, the data is displayed below all that. The search bar and date filter being at the top of the screen is important because it is the first thing a user sees. This means the filter can be accessed first before having to scroll through all of the results to filter it down. Below the table, there is an option to export to csv, which is placed below because it’s understood that you’d only want to export the data after seeing it. The results per page dropdown is also here below the table, as you’d want to increase the number of results after you’ve viewed them all.
Functionality
Filtering by Track
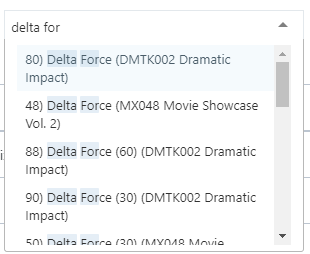
On the track downloads and track plays tabs, I included a dropdown to search through the tracks to show the data for a specific track. This dropdown uses Selectize.js which is a jQuery plugin to transform a text input into a select box with a dropdown. This can query the database on each character inputted to retrieve the most up to date results. The specific section of the result that has been matched with the query is highlighted.
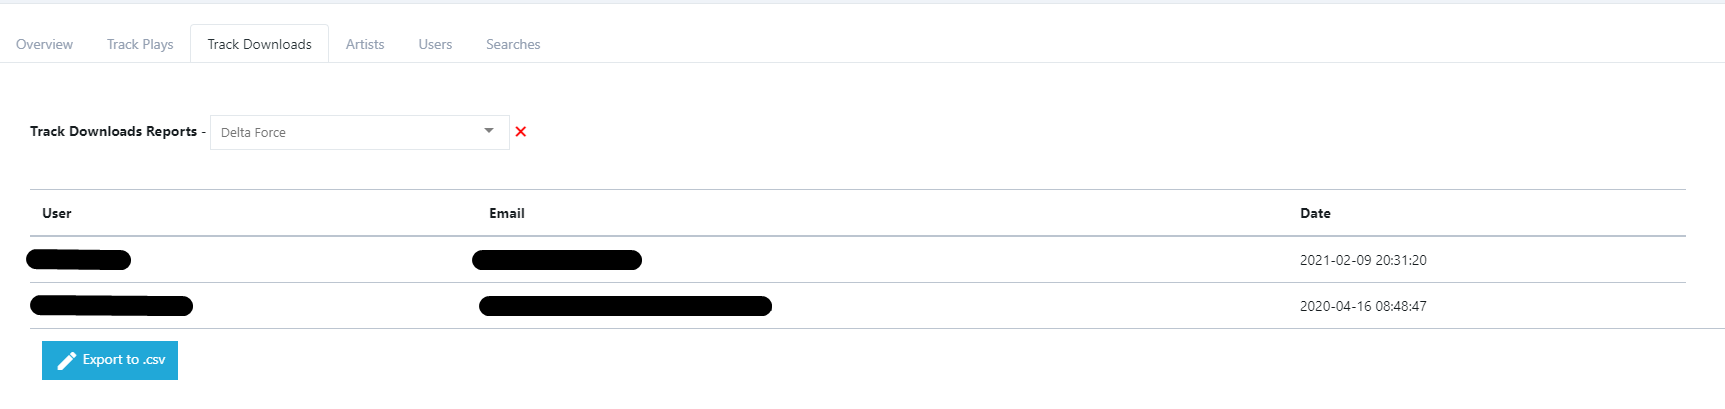
When a track is selected in the dropdown, the returned data is used to display detailed information on the specific track such as which user downloaded/played the track and when. This can also be filtered by date using the date input in the top right.
Filtering by User
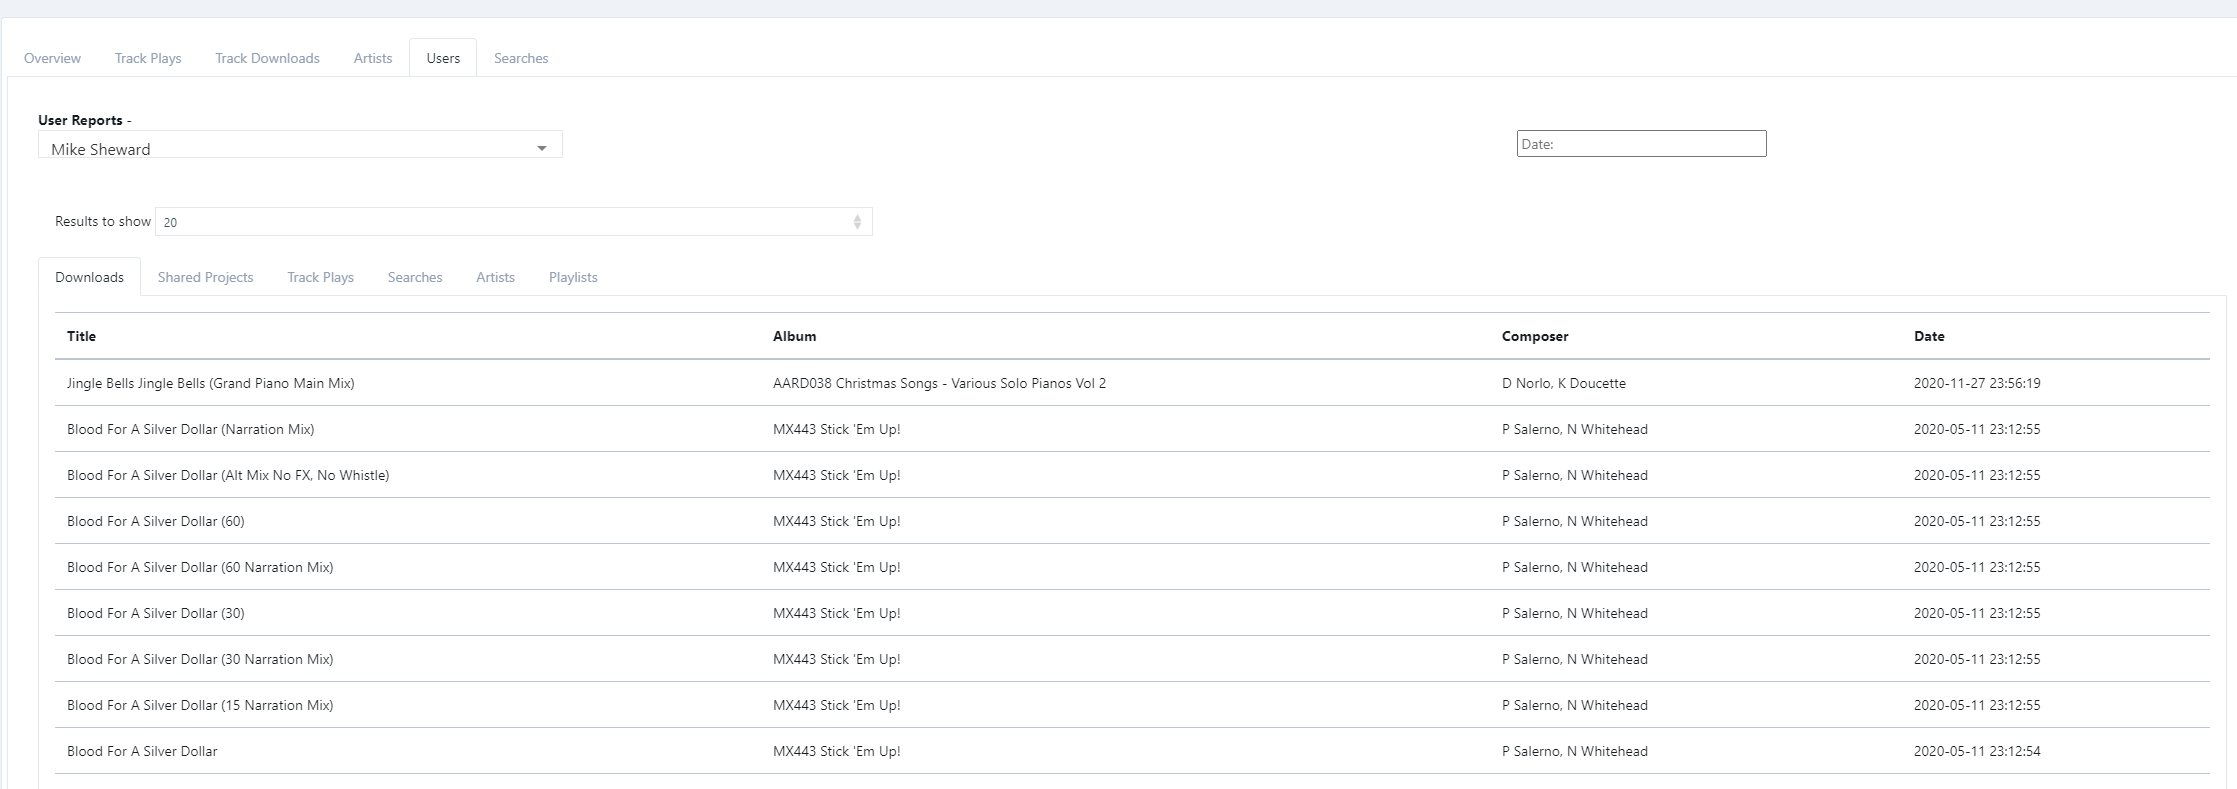
In the user reports section, I included a filter to display the results for a single user. This nests another layer of tabs within the user section to view each track that specific user downloaded/played, the tracks and projects they shared and when, as well as what they searched and what playlist/artist they played from.
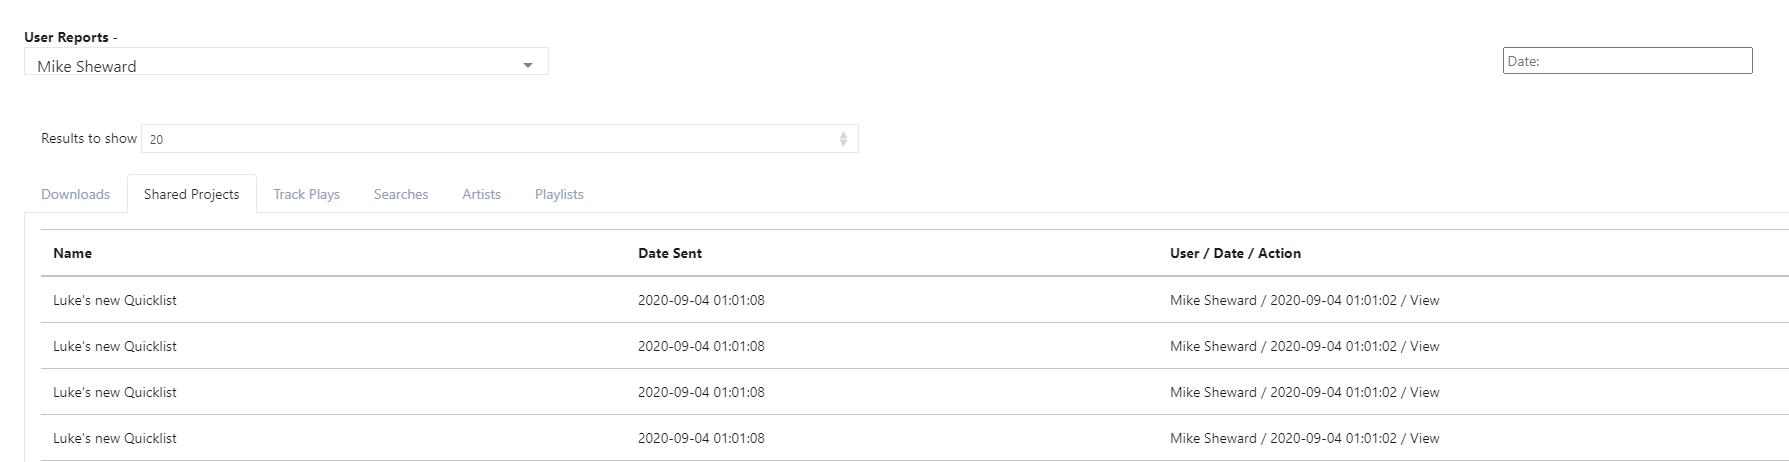
On the shared projects tab of an individual user’s data, the data displayed is of two layers, the first two columns log which project was shared and when, and the third column displays which user accessed the share link, when it was accessed, and what action was taken with the shared project.
Code to log user actions
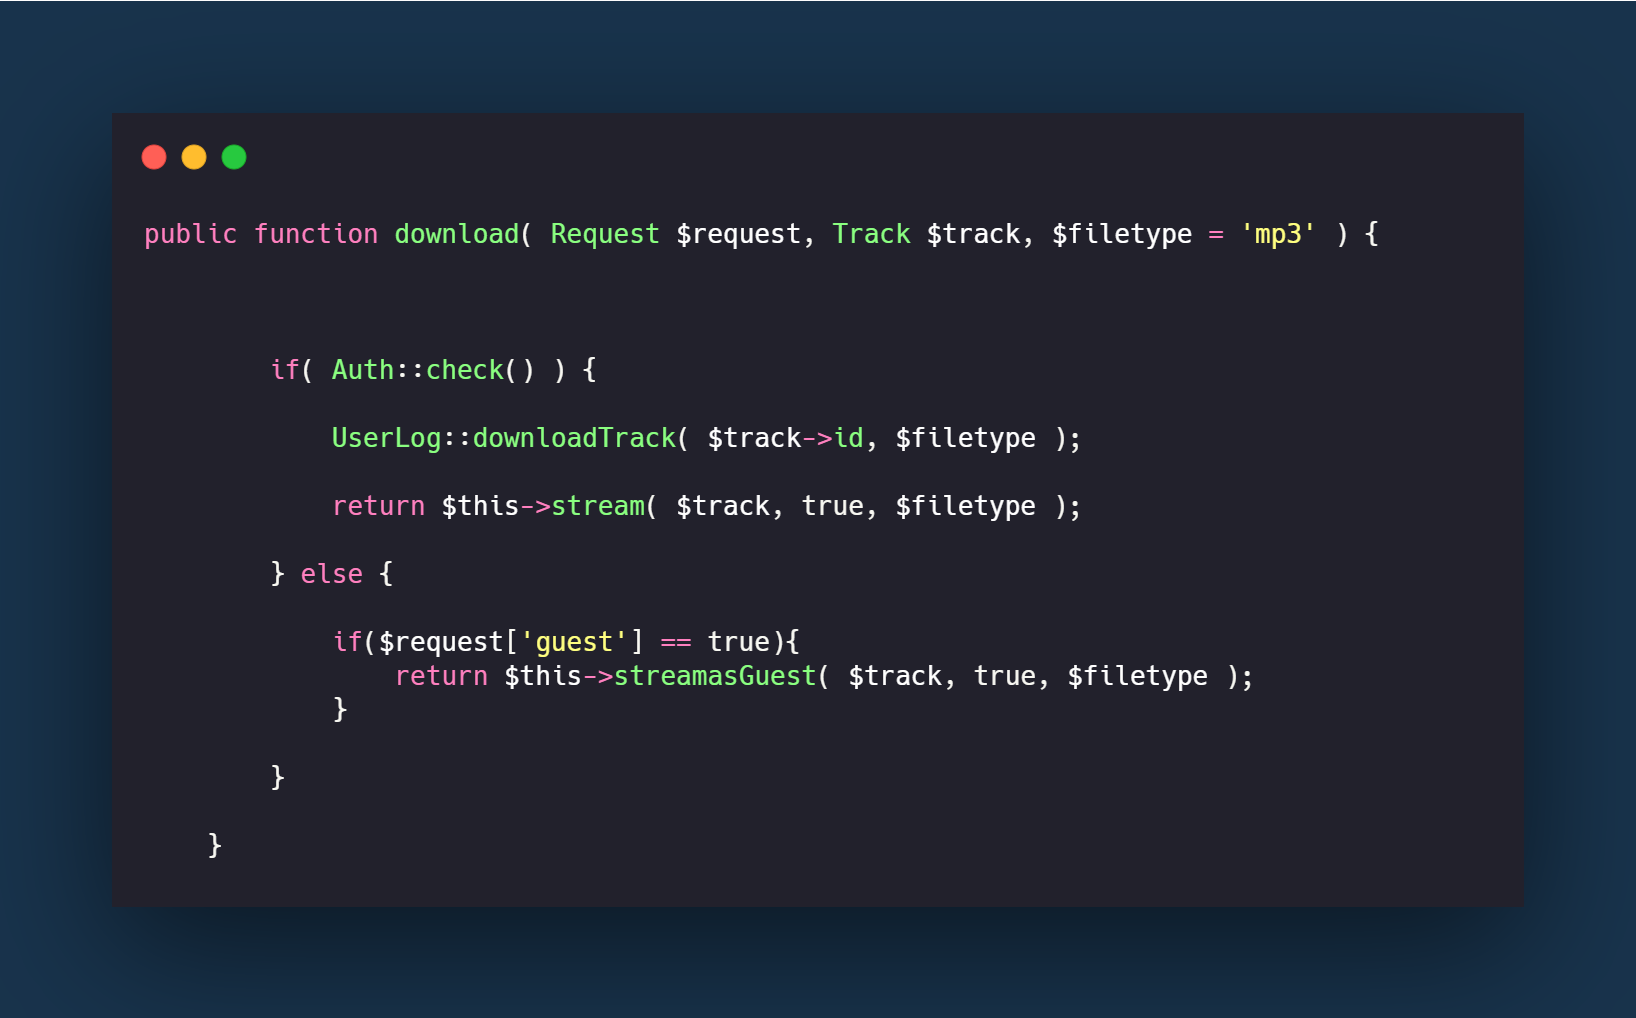
When an action we’d like to report on is made by a user, the relevant function for the action on the UserLog mode is called. In this example, the downloadTrack function is called on the UserLog model when downloading a track. This passes in the relevant data that we would like to store and display in the reports; in this case, it is the track id and the filetype.
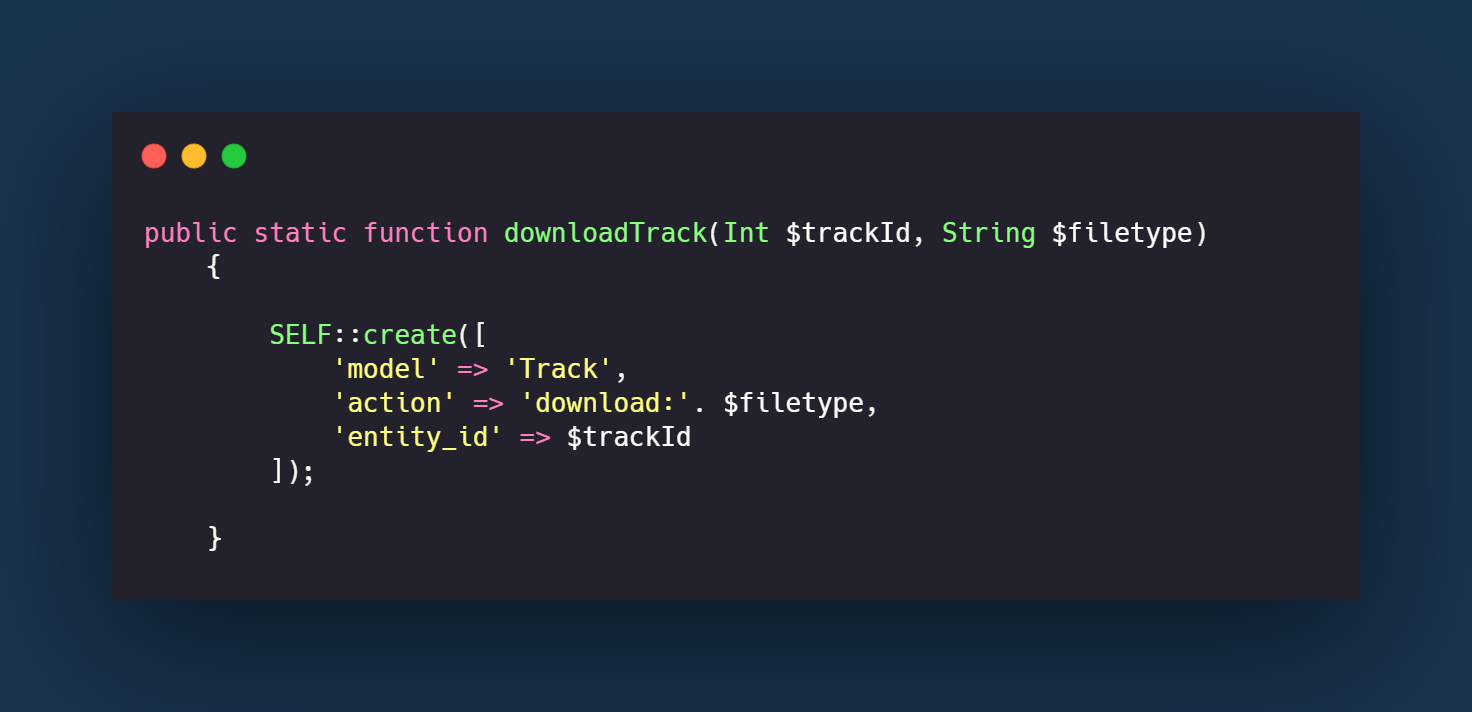
When the downloadTrack function is called in the UserLog file, the data passed in, is used to create an entry in the user_logs table in the database. This database entry specifies which model the action was called on, what action is being logged, and the ID of the entity in the model this action is referring to.
Code to build reports section
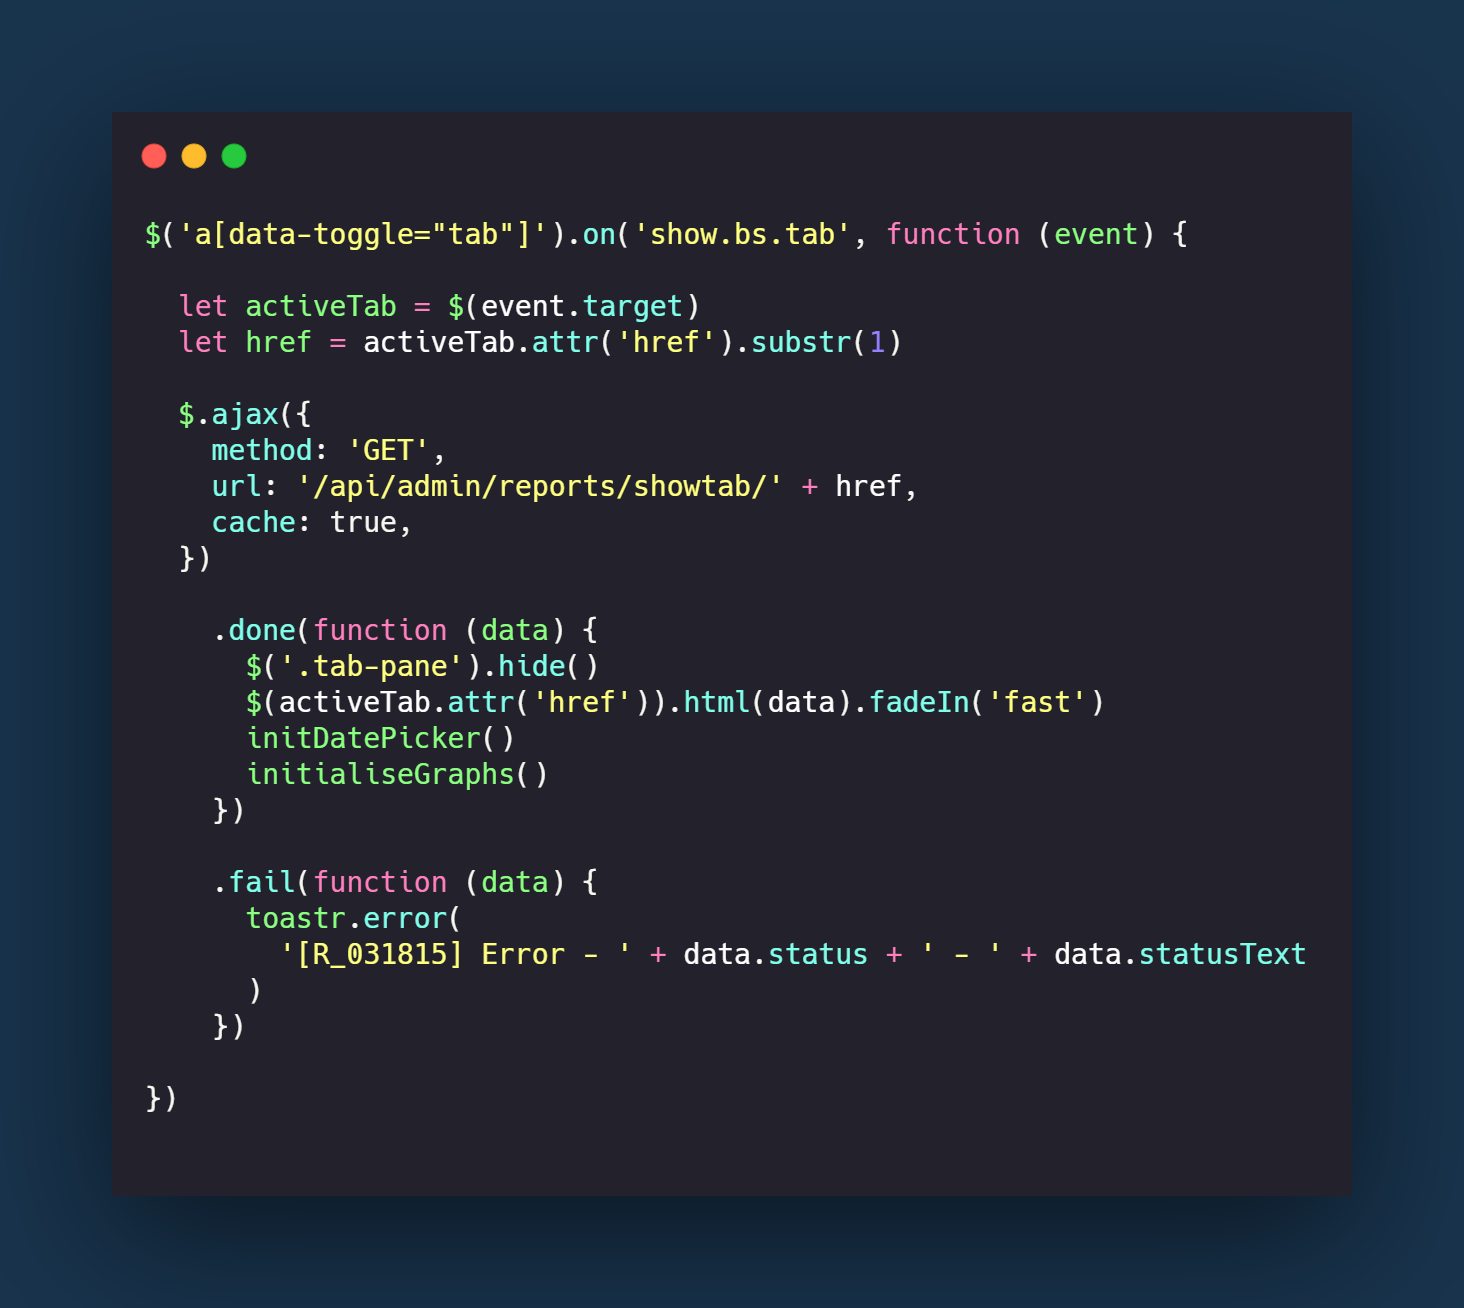
When a tab is clicked, the function will run to retrieve the content of that tab. The href attribute is retrieved from the clicked tab and is passed into the API request to return that tab’s data. Once the data is returned, jQuery will set the tab’s content to the data received from the AJAX request and then switch to that tab.
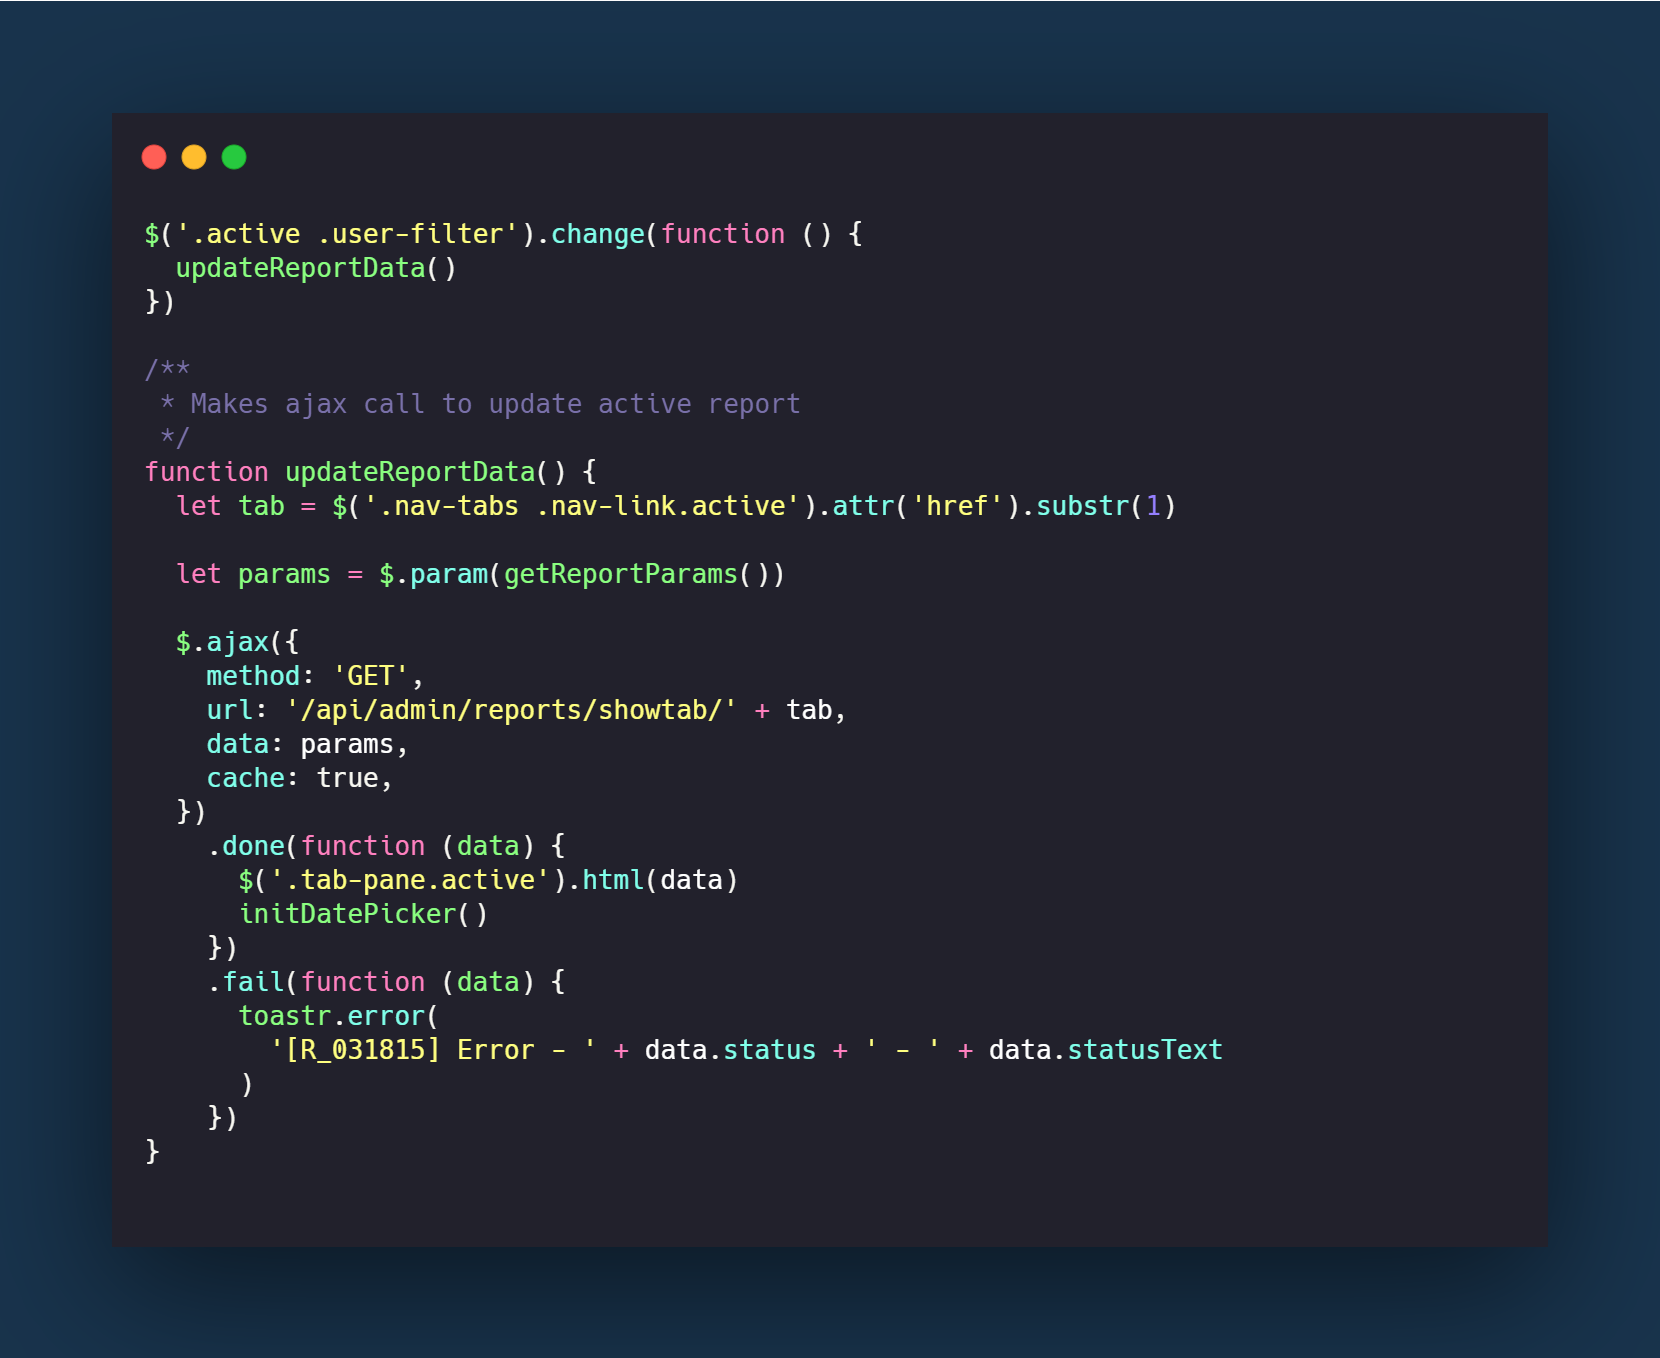
On the events emitted when the date picker value is changed, when the filters are changed, or when the number of results to show per page is changed, I call the function updateReportData (here shown in the user filter example), which runs the AJAX request again, with the newly updated parameters which are retrieved by calling the function getReportParams, and then the tab’s content is replaced with the updated, returned content that reflects the change made in the filters.
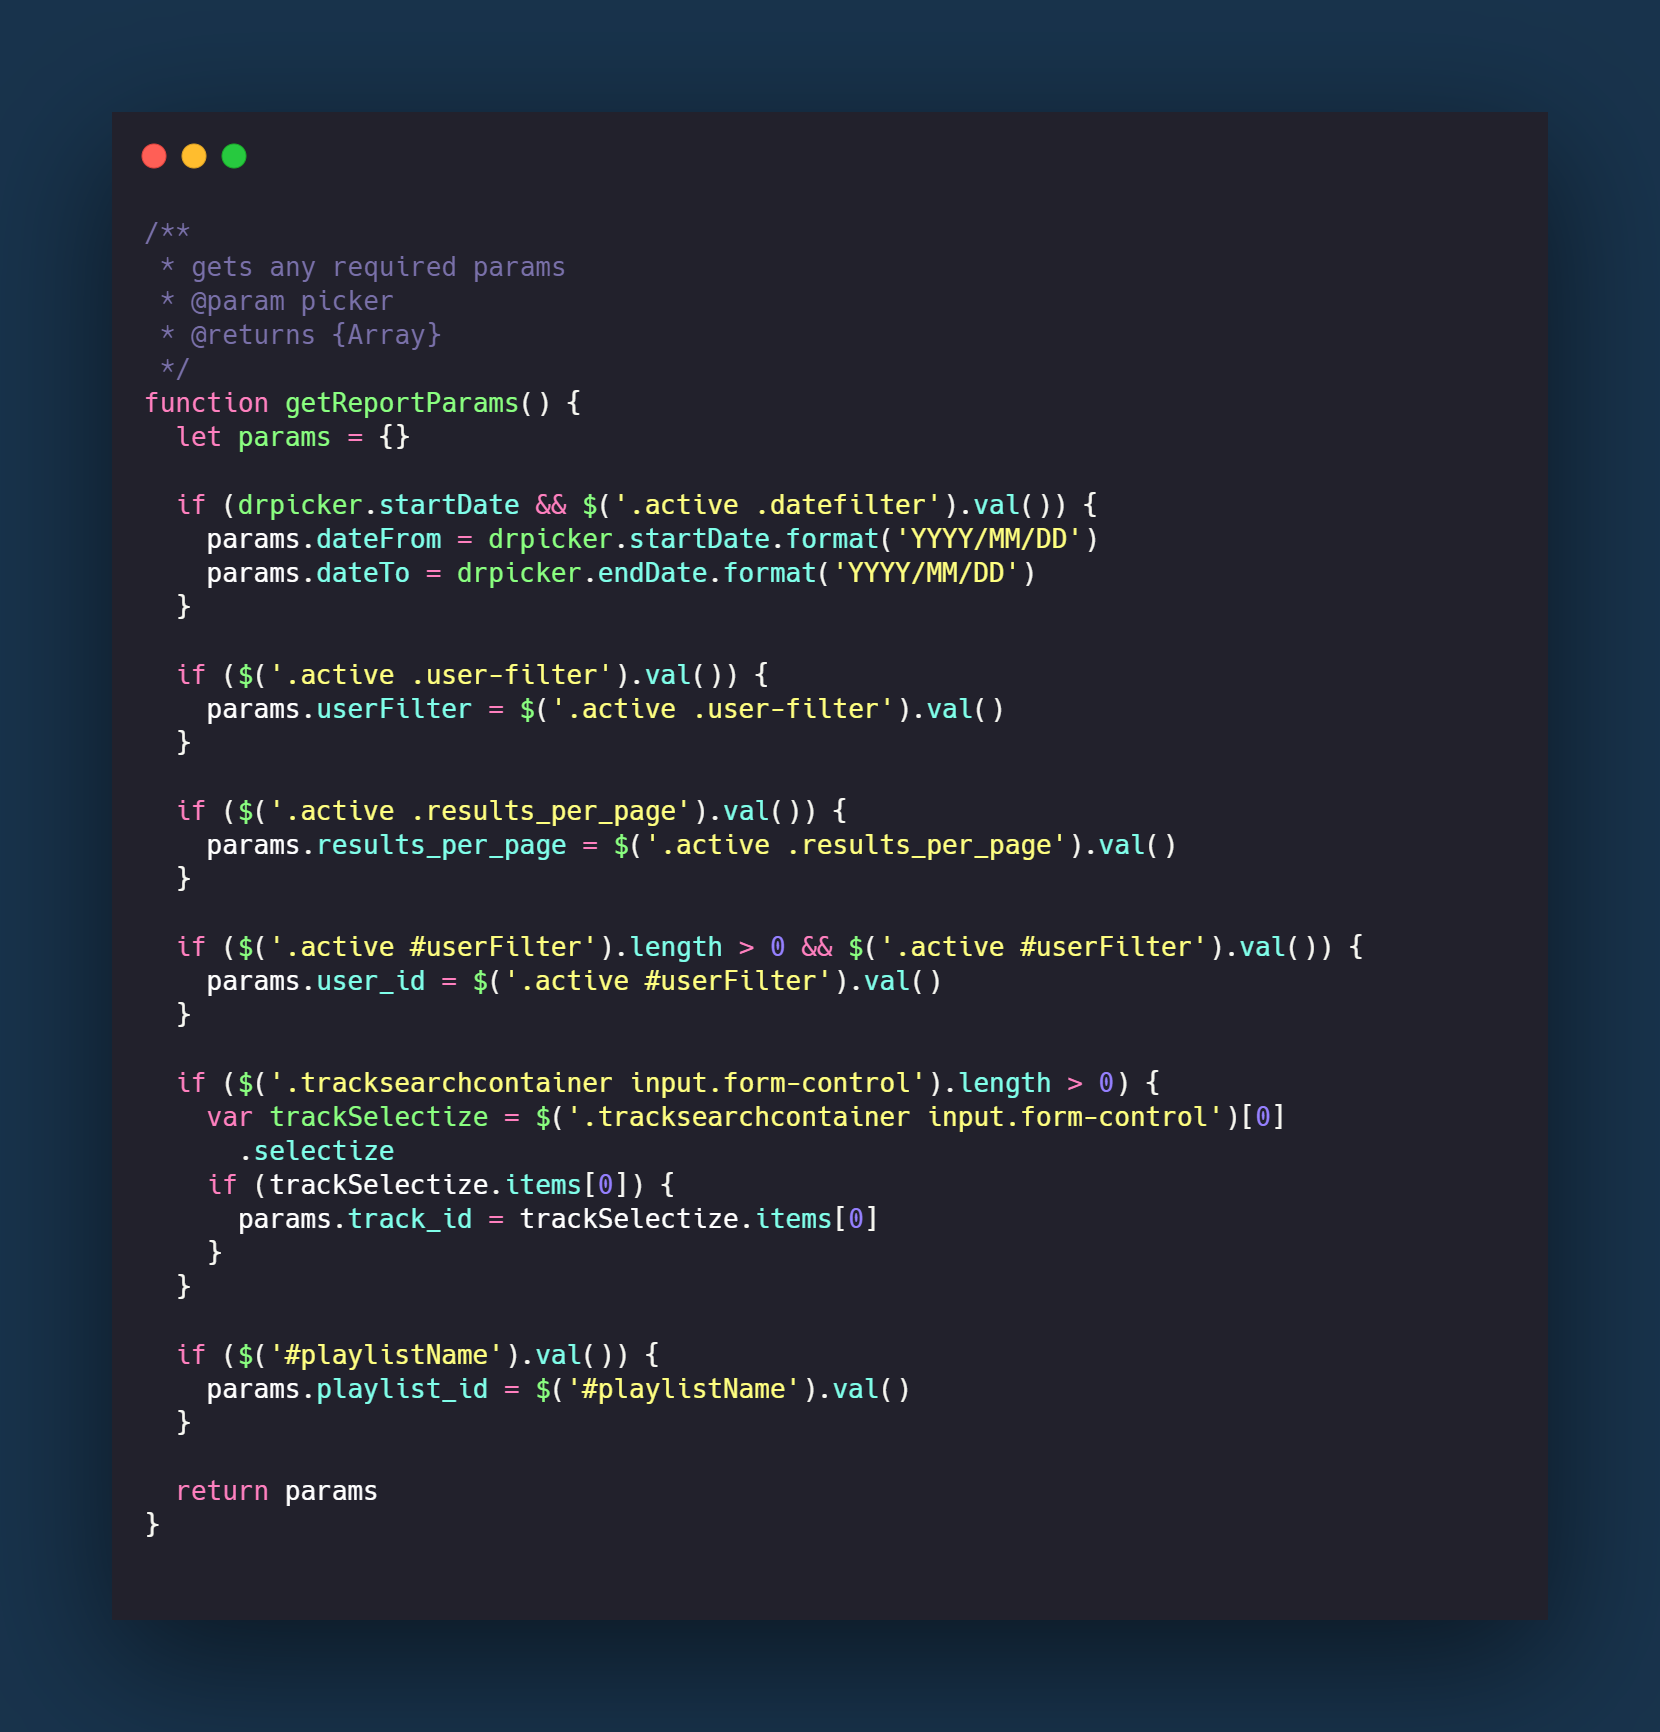
Using the getReportParams function, all of the filtered data is retrieved and added to an object named params which is used in the AJAX call to retrieve the updated, filtered reports.
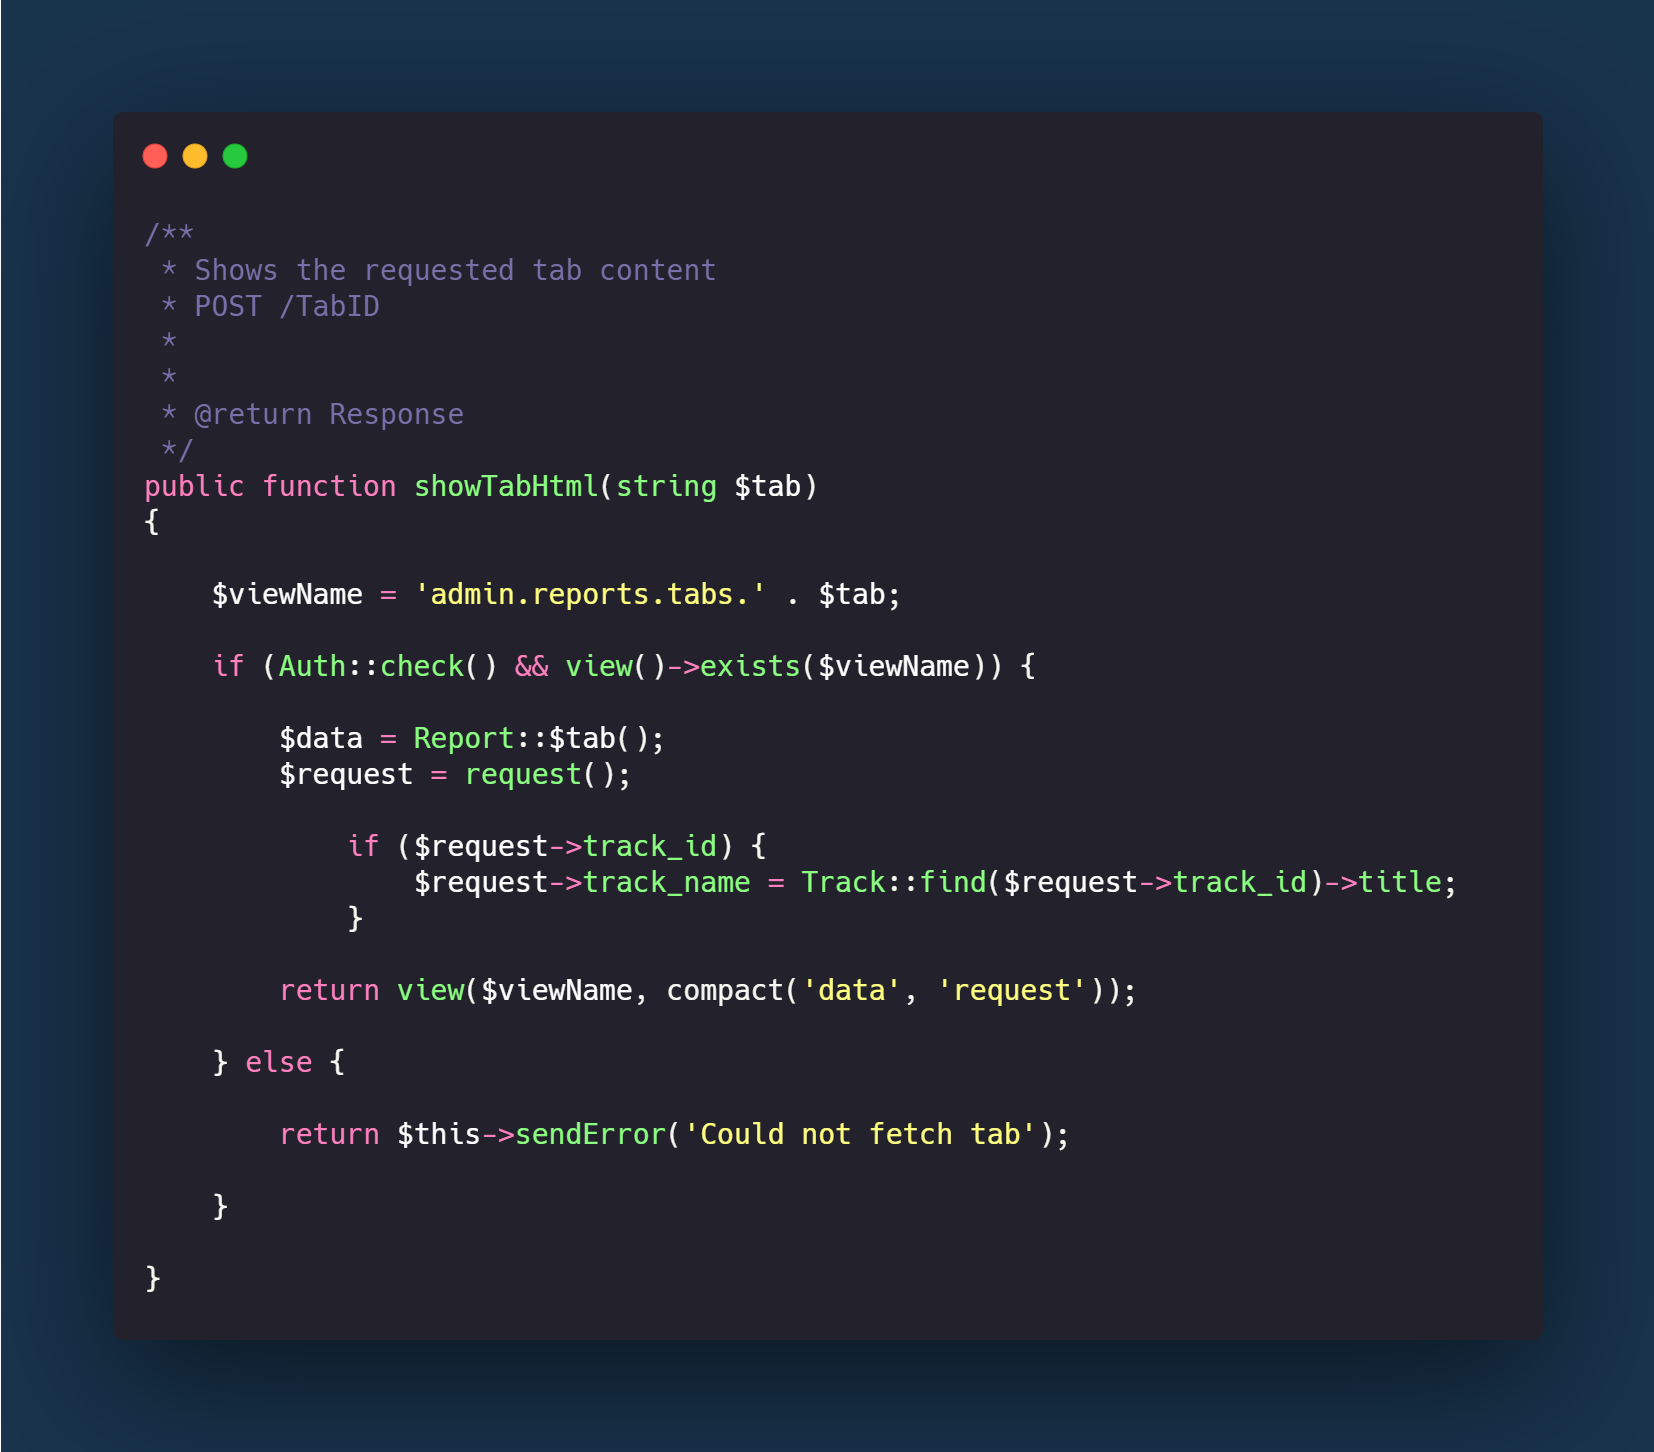
We created this PHP function to be called by the AJAX request to get a tab’s content. In here, the name of the tab is pulled from the request and is used to query the Report model for the data for that tab. In the report model, there are functions with each one corresponding to a tab and containing the SQL query to retrieve the required data.
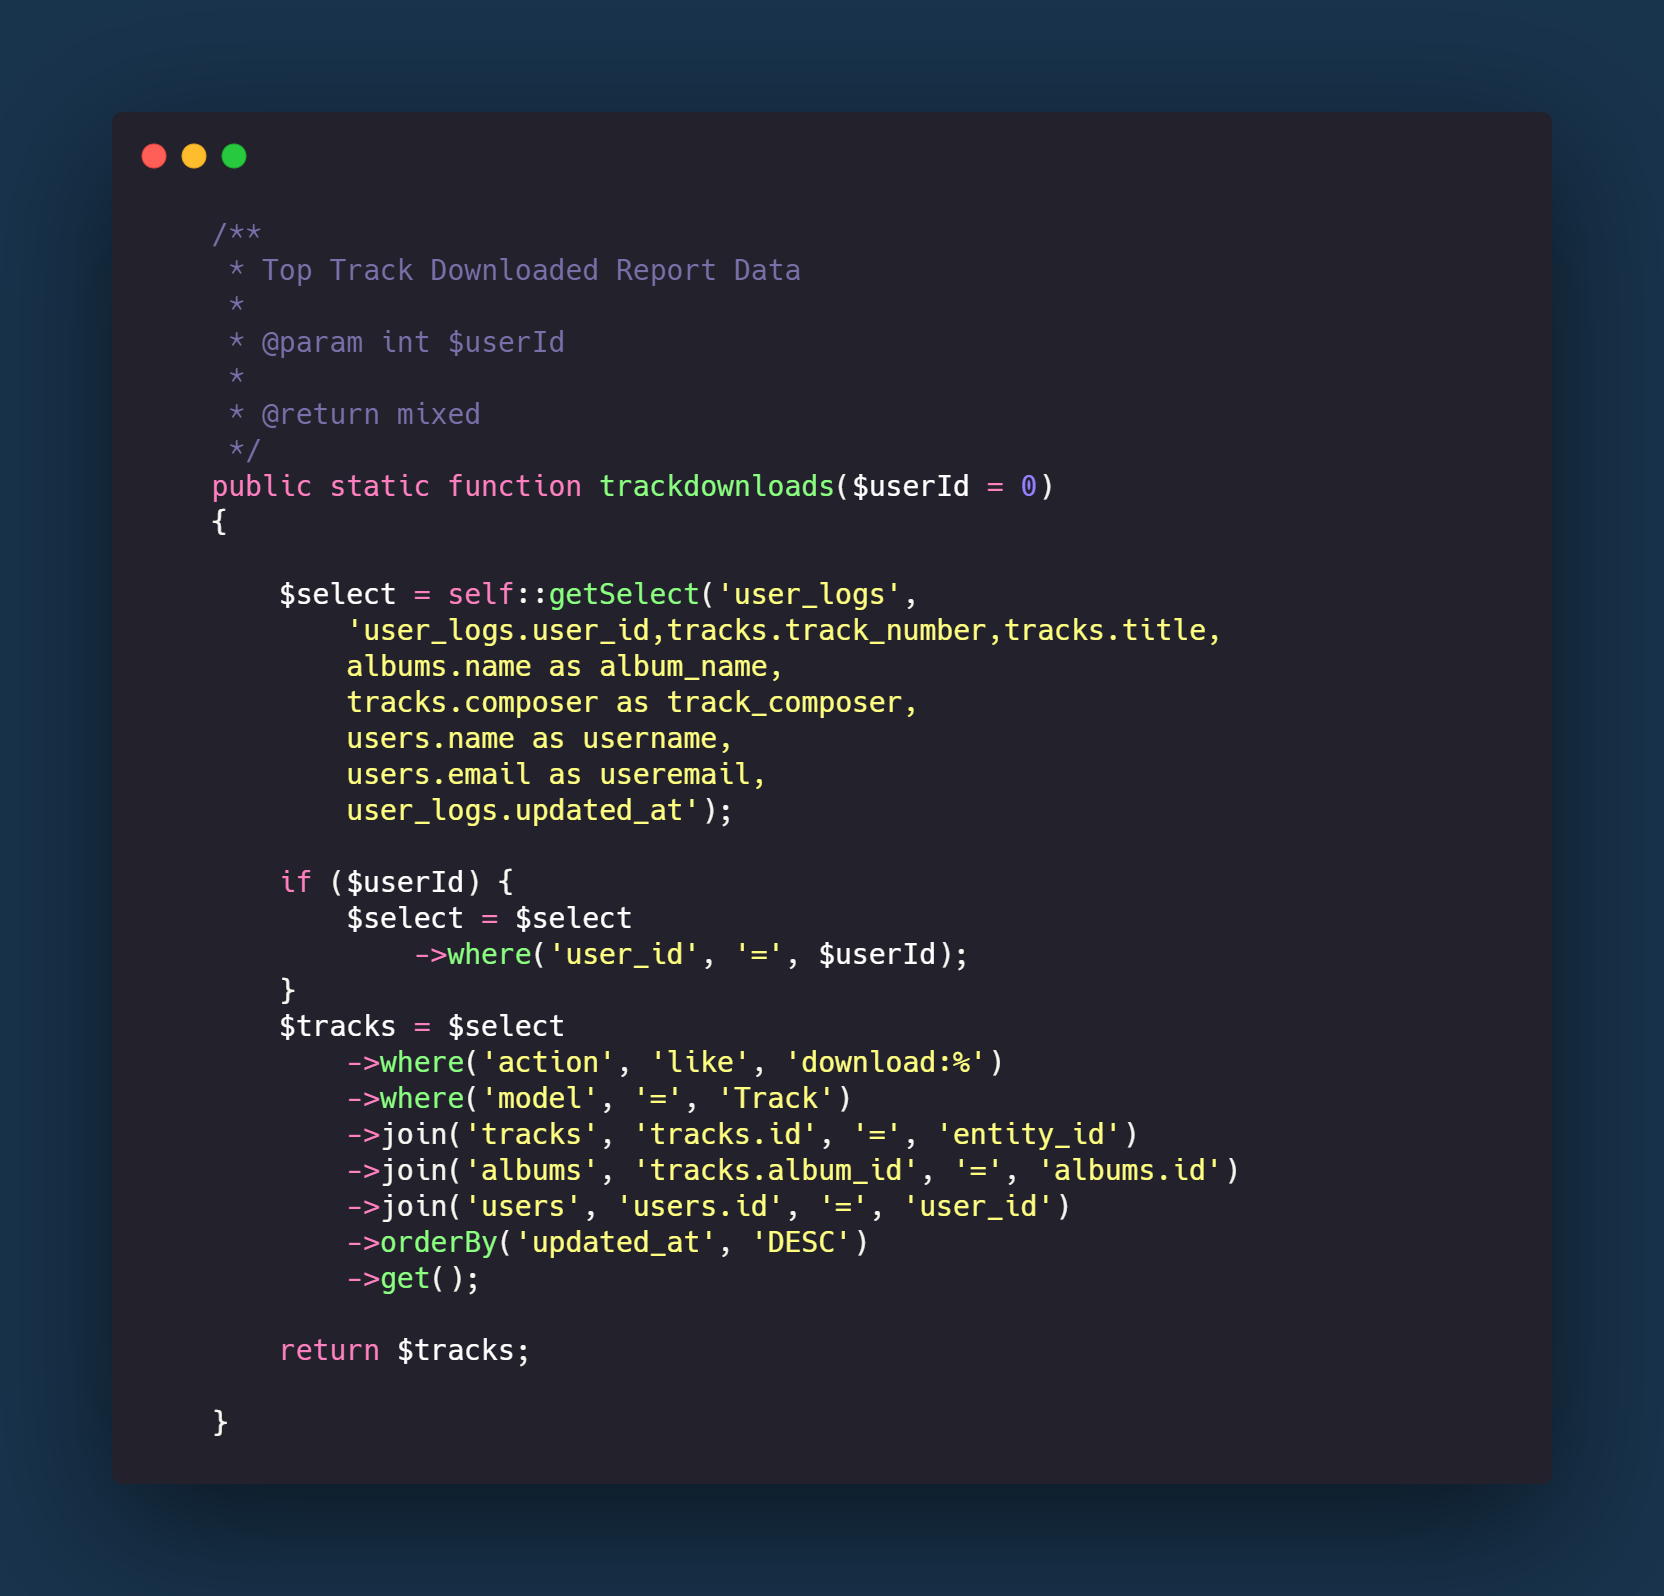
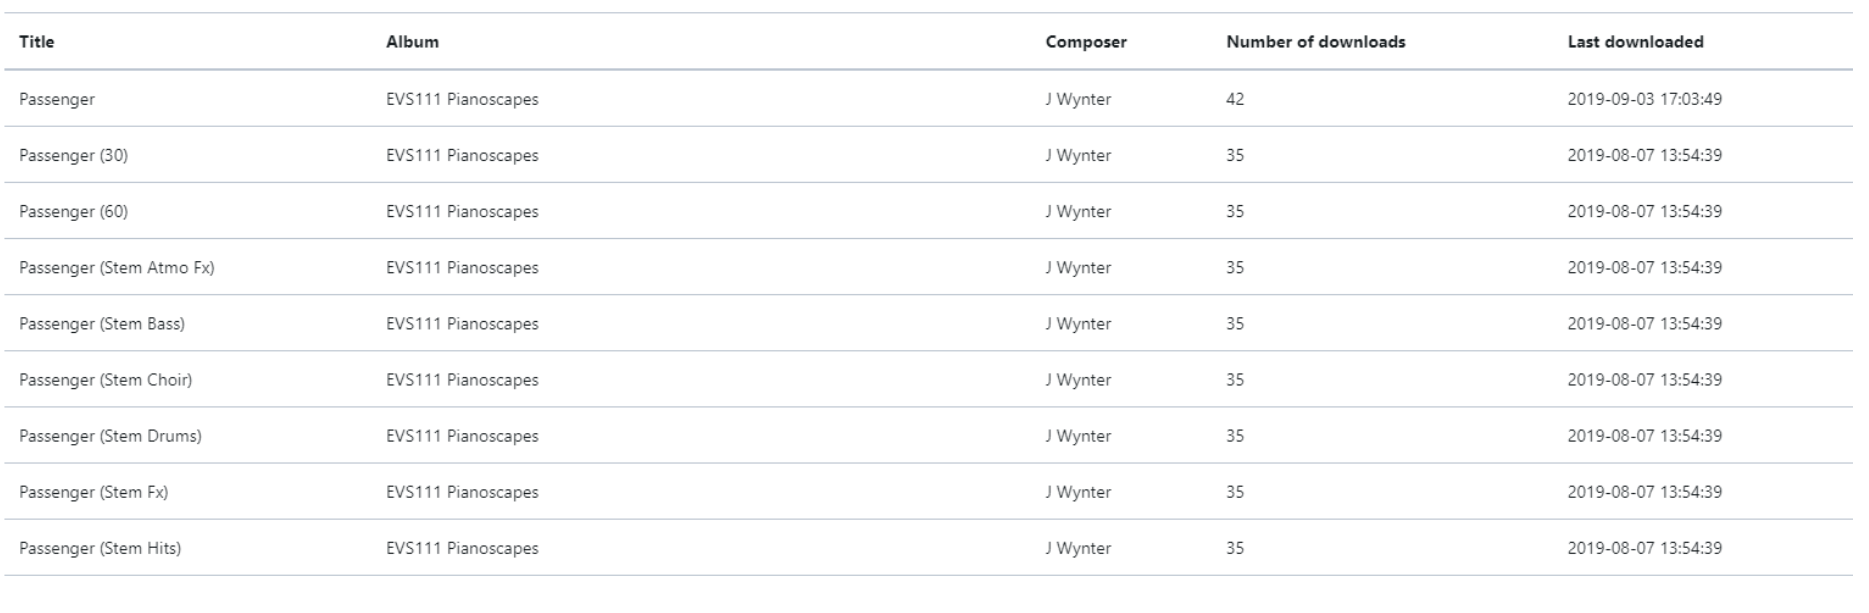
In this specific function, to get the track downloads from the database, the ‘user_logs’ table is queried and results are returned and filtered by the action containing the text ‘download’, as well as the model field being defined as ‘Track’. Once the track and album have been joined to this query to also return the track/album data, the data can then be sorted and grouped by track, returning this data:
Conclusion section
Upon reflection, the above process proved successful in displaying all tracked data requested by the client in one concise working reports section. The view is responsive thanks to the use of Bootstrap to create a tabbed view, and the view can be altered to the user’s needs with the use of the search bar and the dropdown with the option of how many results to display.